Tableau developer interview questions: Tableau is a leading data visualization tool currently and we have discussed this a lot in various posts including top big data BI tools. We keep on receiving to share the updated list of tableau interview questions and earlier we have published real-time tableau interview questions and answers as well.
[Tableau Developer Interview Questions & Answers]
Tableau developer interview questions and answers- Asked In IT Companies
Today, we are going to talk about tableau developer interview questions and answers. Soon, we will also publish tableau admin interview questions and answers. Let’s start and see some top tableau developer interview questions and answers.
Q. What is the difference between context filter to other filters?
When we create context filter in the tableau, Tableau will create a temporary table for that particular filter set and other filters will apply on context filter data like cascade parameters.
For example, suppose we have created context filter on the country field and we have chosen the country as USA and India. Now Tableau will create a temporary table for this two countries data and if you have any other filter, that filter will be applied to the already filtered data of USA and India.
If the context filter is not created, the other filter will behave normally.
Q. What are the disadvantages of context filters?
Here are some of the disadvantages of context filter in tableau-
- The context filter is not frequently changed by the user. If the filter is changed, the database must recompute, and the temporary table will be recreated which will slow down the performance.
- When you set a dimension to context, Tableau creates a temporary table that will require a reload each time the view is initiated. If you are working on any database (let’s say MSSQL) then you must have the permission to create the temporary table.
Q. What are the different products of Tableau?
Here are the main products of Tableau-
- Tableau Desktop- Majorly used by the developer to develop the dashboard. All the development work will be done in Tableau desktop.
- Tableau Server- Once you have created the dashboard in Tableau desktop, you can publish the dashboard to the server and share the link with the users. You can automate the report and schedule it.
- Tableau Reader- It is a free tableau product which is like an app and being used to see the dashboard.
- Tableau Public- Tableau Public is another free tableau product. You can download the tableau desktop and then publish the report to tableau public. The only thing is whatever you will publish to tableau public will be visible to all. And so, make sure you are not publishing any sensitive information.
- Tableau Prep- this is comparatively a new tool by Tableau used for data preparation. You can feel the features we experience with ETL (extract transform load)
Q. What is the current latest version of Tableau Desktop?
As of 28th August 2018, the latest Tableau desktop version is 2018.2
Q. What is data visualization?
Data visualization refers to the techniques used to communicate data or information by encoding it as visual objects (e.g. points, lines or bars) contained in graphics.
Q. Why Tableau?
Tableau is a leading data visualization tool in the industry and most trusted as well. Since last 5 years, Tableau is coming on the top of Gartner magic quadrant and have lots of features and security. They provide connection to 100+ data sources directly making your work easy.
Q. What are Filters? How many types of filters are there in Tableau?
The filter is a way to restrict the data flowing to your tableau worksheet and dashboard. In Tableau, we have majorly 3 types of filters-
- Quick filter
- Context filter
- Datasource filter
Q. What is disaggregation and aggregation of data?
Aggregation and disaggregation are the ways to compare the data values in Tableau. When you place a measure in the shelf, it automatically aggregates in the aggregated level. By default, it is SUM and you can change it to other aggregated level.
 Disaggregation of the data means viewing each data source row while analyzing the data both dependently and independently. Disaggregating the data means viewing every row of the data source. To see the disaggregated data, simply use the sample superstore dataset and show the subcategory wise sales. You will find the sales being aggregated at the SUM level. Now to see the disaggregated level, simply follow, Analysis -> Aggregate Measure and you will find the data showing like below-
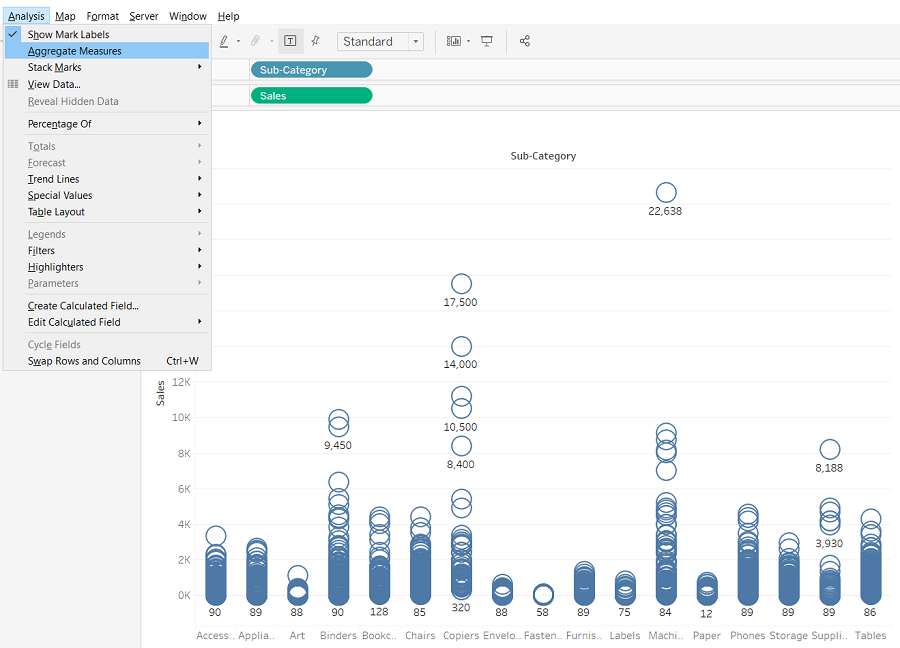 Q. How to remove the All options from a Tableau auto – filter?
We have two option here-
- Right click on the filter measure and select all the checkbox
- Right click on it and select Use All option
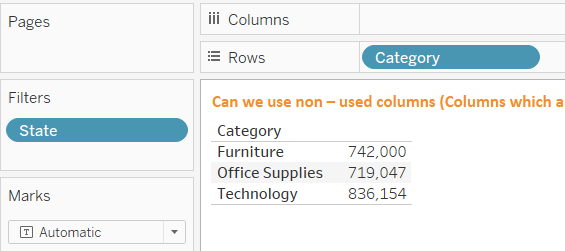
 Q. Can we use non – used columns (Columns which are not used in reports, but the data source has columns) in Tableau Filters?
Yes!
For example, here I am showing category wise sales and have made a filter on a state basis. As the data are dependent and so, if you have unselected any state, their corresponding data will be filtered out.
 Q. What is the benefit of Tableau extract file over the live connection?
The extract can be used anywhere without any connection and you can build your own visualizations without connecting to Database. Also, it helps with the performance in the tableau.
Q. Max no of tables we can join in Tableau?
As of now, we can join the maximum 32 tables in Tableau.
Q. What is the difference between joining and blending in Tableau?
Joins in Tableau
For E.g.: your client is in Healthcare domain and using SQL Server as their database. In SQL server there may be many Tableau like Claims Tables, Rejected Claims Table, Customer Table. Now, the client wants to know customer wise claims and customer wise rejected claims table using the joins. Join is a query that combines the data from 2 or more tables by making use of Join condition.
We can join max 32 table, it’s not possible to combine more than 32 tables.
In Tableau the joins can perform in 2 ways.
- By making use of common columns.
- By making use of common data types.
If we create joins on the fields in Tableau all the table names are suffixing with $. While performing the joins on multiple tables, always go with the less amount of data tables, so that we can improve the performance.
In Tableau the joins are divided into 2 types.
- Equi Join,
- Non-Equi Join
Equi Join: in the join condition if we are using Equality “=” operator then such a kind of join called as Equi join.
Non-Equi Join: in the join condition apart from the Equality “=” if we use any other operator like <,>,<=,>= and=! Then such a kind of joins is called as Non-Equi Join.
Equi Join is divided into 3 types
- Inner Join
- Outer Join
- Self – Join
Inner Join: Inner join will load the only matching records from both tables. Inner join condition:
Tableaa.id = Tableb.id
Outer Join:
Again the outer join divided into 3 types.
- Left Outer Join
- Right Outer Join
- Full Outer Join
Left outer join: displays the complete data from the left + matching records from the left.
Condition: tablea.id(+).
Right Outer Join: displays the complete data from the right + matching records from the left.
Condition: tablea.id(+)=tableb.id
Full outer join: full outer join load the complete data from the left table and right table. Condition: Table A full outer join Table B ON tablea.id= tableb.id
Self-Join: if we are performing a join to the same table itself such a kind of join called as self-join
Non-Equi Join:
In the join condition if we are using the operators apart from the equality “=” then such a kind of joins are called as Non-Equi join.
Data Blending in Tableau
For example: your client is the same Healthcare Client. They are operating their services in Asia, Europe, NA and so on & the are maintaining Asia data in SQL, Europe Data in SQL Server and NA data in MY SQL.
Now, your client wants to analyze their business across the world in a single worksheet. So you can’t perform join here.
Now you have make use of Data Blending Concept.
Normally in the Tableau, we can perform the analysis on the single data server. If we want to perform the analysis from the multiple data sources in a single sheet, then we have to make use of a new concept called as data blending.
Data blending mix the data from the different data sources and allow the users to perform the analysis in a single sheet. Blending means mixing. If we are mixing the data sources, then it is called as data blending.
Rules to perform the data blending
In order to perform data blending, there are few rules.
- If we are performing the data blending on 2 data source these 2 data sources should have at least 1 common dimension.
- In that common dimension at least 1 value should match.
In Tableau, we can perform the data blending in 2 ways.
- Automatic way: In the automatic way Tableau automatically defines the relationship between the 2 data sources based on the common dimensions and based on the matching values and the relationship is indicated with Orange color.
- Custom or Manual way: In the manual or custom way the user needs to define the relationship manually.
Data blending functionality
- All the primary data sources and the secondary data sources are linked by a specific relationship
while performing the data blending each worksheet has a primary connection and optionally it might contain several secondary connections. - All the primary connections are indicated in the Blue in the worksheet and all the secondary data sources indicated with the Orange color tick mark.
- In the data blending 1 sheet contains 1 primary data source and 1 sheet can contain an end number of secondary data sources.
For more details on Data join and data blending, you may also check our real-time tableau interview questions and answers.
Q. What are Dimensions and Facts?
Dimensions are those columns which are descriptive, and measures are those columns which are numerical. In layman term, you can also say, all the columns whose values are fixed are dimensions and whose value can change are measure.
By default, based on Tableau internal AI, it detects dimension and measure from your dataset. But you are completely independent to convert any measure to dimension and vice-versa.
Conclusion
These were some of the top tableau developer interview questions and answers. These tableau developer interview questions were shared by our contributors and professionals working for us. If you also want to write for us or want to work with us, please connect on the email id given.
Tableau Developer Interview Questions
-
Tableau Developer Interview Questions
Summary
These were some of the best and most frequently asked Tableau developer interview questions along with answers provided here. Make sure you are practicing these Tableau interview questions and answers for an added advantages in the interview.


I am happy for sharing on this blog its awesome blog I really impressed. thanks for sharing. Great efforts.