Datameer! (Datameer Tutorial)
Heard of this tool before?
Well, few of you might have heard while others may not. Like any other data visualization tools, Datameer is also one of the popular data visualization tools for big data.
 Recently, I have started working on Datameer and didn’t find many resources available on the internet and so thought to share whatever I know. I will be talking about Datameer Tutorial and will ensure that this guide is serving the purpose of the title. We will make it completely to a beginner guide to Datameer or Datameer for dummies, whatever you call it is.
This Datameer Tutorial will be a detailed guide and so we will divide this in the different topic so that it will be easy for you to understand. Also, we will start from the very basic of Datameer and then we will go to the advanced section. Also, we will see how you can clear Datameer analyst level certification.
Let’s start with the Datameer Tutorial and explore another world of Data Visualization!
You can check our video for the complete beginner Datameer Tutorial as well. If you are looking for a transcript, keep on reading.
What is Datameer? – Datameer Tutorial
The very basic question one can ask is what is Datameer?
As per the official definition of the platform by the company,
“Datameer is a big data analytics platform that turns your complex data into actionable insights through agile data preparation and analytics. Using Datameer, organizations like yours can deliver insights in hours instead of months and operationalize them immediately, increasing your business agility and responsiveness.”
Now, let me put it in my words based on my experience working with Datameer since last six months.
Datameer is a data visualization tool specially designed for Big Data which allow you to get useful insight from your complex data. This is definitely not a Hadoop platform and just like any other visualization and analytics platform.
Started in 2009, Datameer is one of the fastest growing data analytics platforms in the world. Many big companies are using Datameer to analyze the data and get the insight from it.
If you have a little insight of other visualization tools like Tableau, QlikView, etc. then getting through Datameer will be very easy for you.
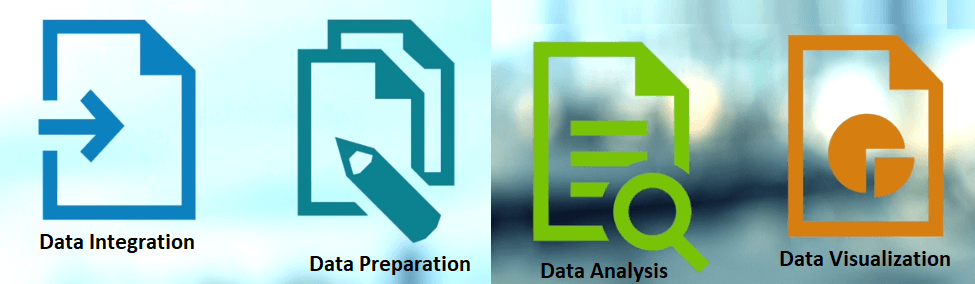
Datameer is kind of a complete data analytics tool and help you to do the following-
- Data Integration
- Data Preparation
- Data Analysis
- Data Visualization
 One thing you should note here is, Datameer is mainly a big data analytics tool and it uses Hadoop system to store their data and files. Like any other analytics tool, it also supports connections with many other data sources and tools which we will discuss in the later section.
Here is the introduction of Datameer by the official company. You can have a look to better understand.
How to start with Datameer?
Well, unlike Tableau, Datameer doesn’t have any desktop tool for development and they have a web interface for all your work. And needless to say, it is a paid tool but the trial is available for 14-days.
How to get Datameer Free Trail
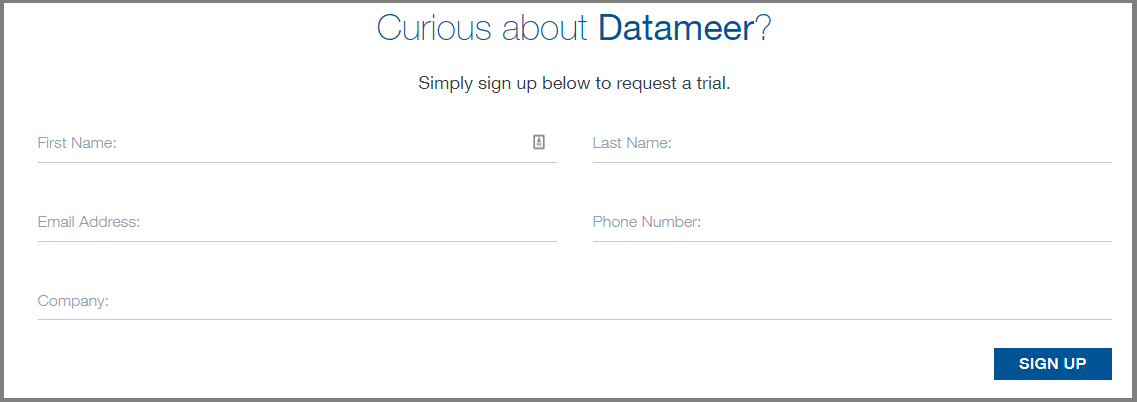
Datameer provides 14-days of free trial to everyone. You need to sign up for the free Datameer trial using this link.
There will be a simple form which you can fill and submit.
 You will receive an acknowledgment email from their team that they are working on it and will share the details soon. You should keep this email carefully as sometimes you may not hear from them since long. If you don’t receive any response, you can make follow-up or raise a ticket to their support team.
You will receive an email from them with a link and other account details. That link will work for 14 days and you can start with the amazing world of Datameer in those 14-days. If you are satisfied with their features and if the tool fulfills your requirement, you may go ahead with their paid plans.
Datameer offers personal as well as enterprise plans. The personal plan is available at just $25 per month where as you need to get in touch with their support team for the enterprise plans.
 Once you will get your free Datameer trial and you log in, you will get the interface something like below.
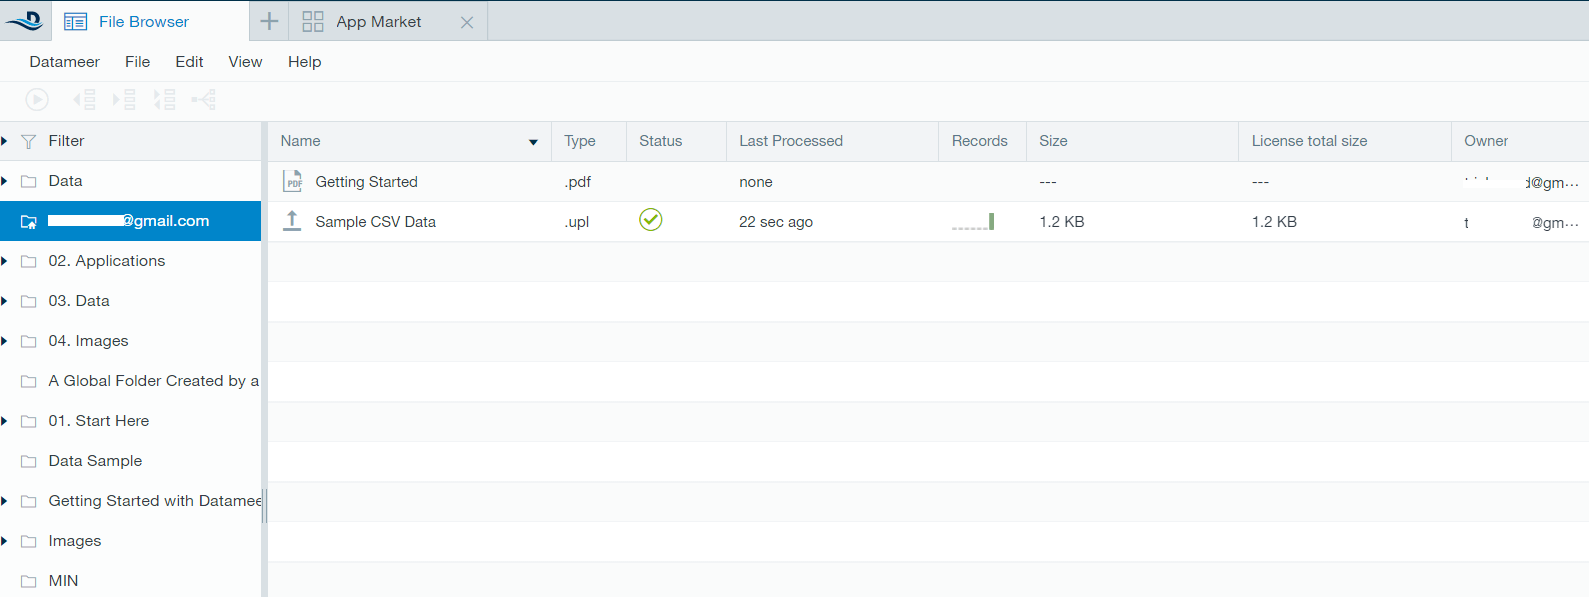 Now your Datameer is setup and you are ready to go ahead with the amazing world of data analytics. Also, Datameer provides a sample sheet which will help you get started with the visualization.
Data source Supported by Datameer
Here are the supported data sources by Datameer. You can connect these tools directly with Datameer and get started with the work.
| Data Source Name | Input | Output |
|---|---|---|
| Text Files | Yes | No |
| Cobol Copybooks | Yes | No |
| CSV/TSV, etc. | Yes | Yes |
| Apache Avro | Yes | Yes |
| Apache Web Server Logs | Yes | No |
| MS IIS Web Server Logs | Yes | No |
| Twitter Firehose (files) | Yes | No |
| Facebook Graph API (files) | Yes | No |
| Fixed Width Text | Yes | No |
| HTML | Yes | No |
| JSON | Yes | No |
| XML | Yes | No |
| MBOX (email archive files) | Yes | No |
| Hive Metastore | Yes | Yes |
| HiveServer2 | Yes | Yes |
| HBase | Yes | No |
| Cassandra | Yes | No |
| MySQL | Yes | Yes |
| Oracle | Yes | Yes |
| DB2 | Yes | Yes |
| MSSQL | Yes | Yes |
| PostgreSQL | Yes | Yes |
| HSQL-DB | Yes | Yes |
| Teradata | Yes | Yes |
| Teradata Aster | Yes | Yes |
| Netezza | Yes | Yes |
| Vertica | Yes | Yes |
| Greenplum | Yes | Yes |
| Sybase IQ | Yes | Yes |
| Excel Workbooks | Yes | Yes |
| Log4j Log File | Yes | Yes |
| Windows Azure Blob Storage | Yes | Yes |
| ORC (Optimized Row Columnar) | Yes | No |
| Parquet | Yes | Yes |
| Amazon Redshift | Yes | Yes |
| Tableau | No | Yes |
| Spark | Yes | Yes |
| OpenStack Swift | Yes | Yes |
Here Input means, you can get the data from these sources in Datameer and Output means, you can export data from Datameer in these formats.
The interesting thing I found with Datameer is, it doesn’t allow Tableau as input but you can export the Datameer data for Tableau.
Also, if you are trying to connect Datameer to Cassandra then you will have to use Connector which is available for free.
Datameer also supports following compression codecs-
- .gz
- .bz2
- .lzo
- Snappy
- .zip
- .Z
Now as you know the supported data sources in Datameer, it’s time to get started with the real work. Let’s see how to upload a file in Datameer.
Data Analysis Using Datameer
In this section, we will see how to add a file, do the analysis and then how to visualize those analyzed data.
How to Add a File to Datameer
Let’s say you have a sample named Demo Data.csv. You can download that file, using the below link.
Head over to the Datameer dashboard and by default Browser tab will be open. This is the tab where you can find all the files, workbooks, worksheets, infographics etc. So, you can say this is the summary area of Datameer.
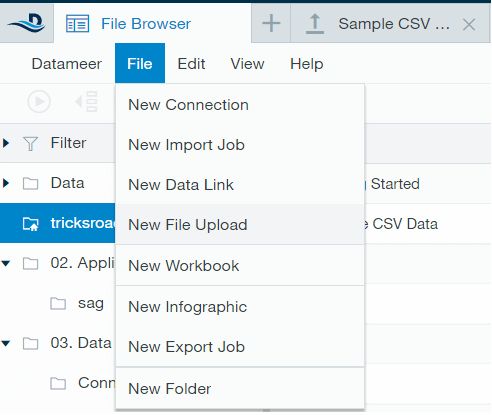 Click on the “New File Upload” button and browse your file. It will open a new window for you to browse the file. You can select the file type if the default one is not the correct one.
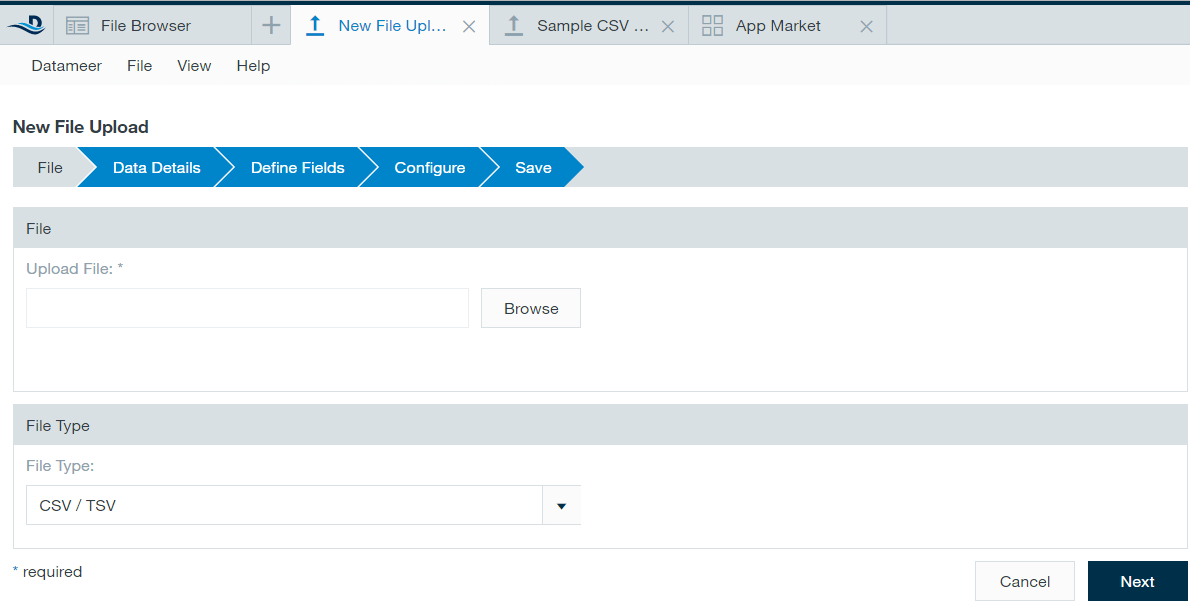 Click on Next and in the next section, it will ask for few more details like the field separation etc. Fields are self-expletory and you can easily go with the next section.
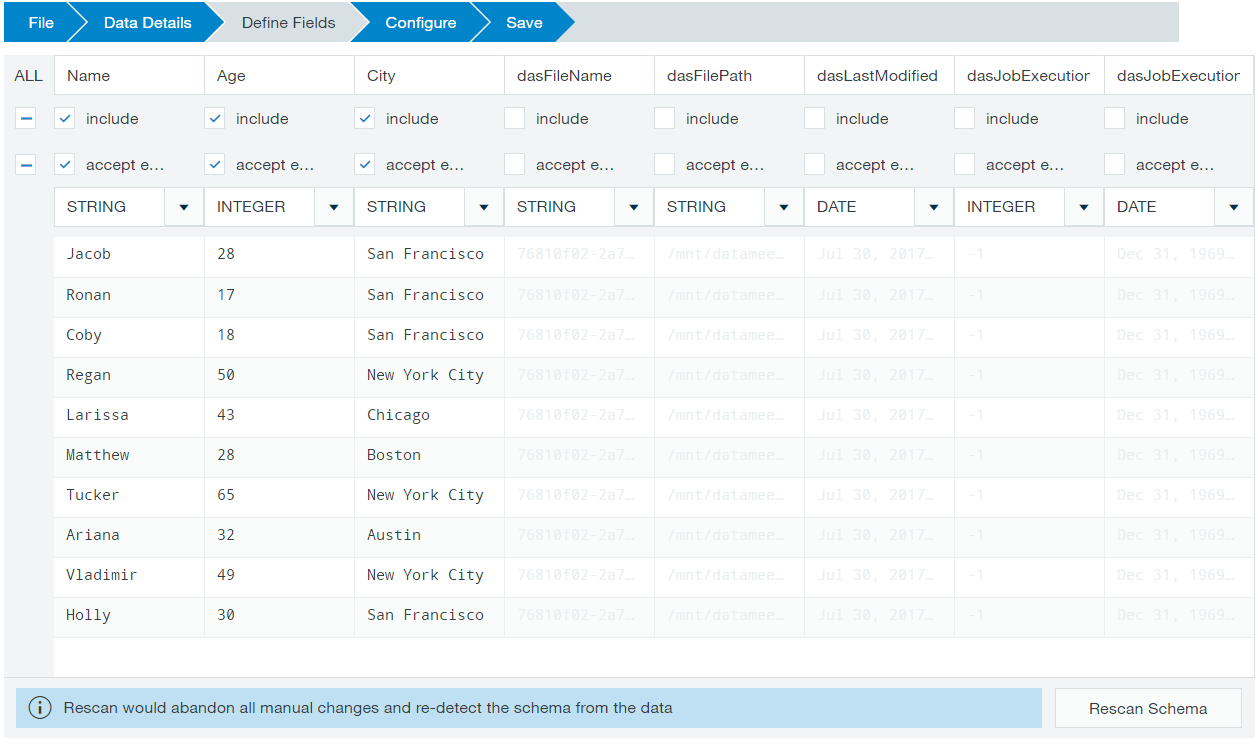
 The next window is important where the tool will show you the preview of your data. Make sure the preview is correct and showing the data as you expected. Also, it will show you the datatypes for each field. If those are correct then well and good as else you can change it from the drop-down list.
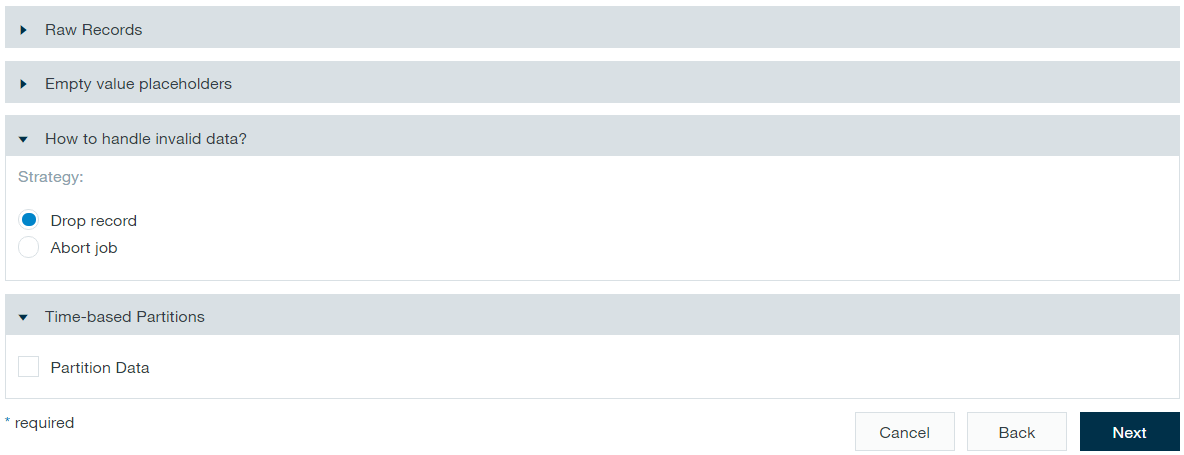
 On the same window, at the bottom, you will find few more expandable sections which are very important. You can make changes to these section as per your data. For example, what you want the tool to do with the NULL records etc.
 It is always a good idea to visualize the data using a dataset instead of the complete live data for performance purpose. You can select it here. By default, the value Datameer recommends is 5000 which you can edit as per your need. In the sample file, we are using doesn’t have much data and so you can ignore this step.
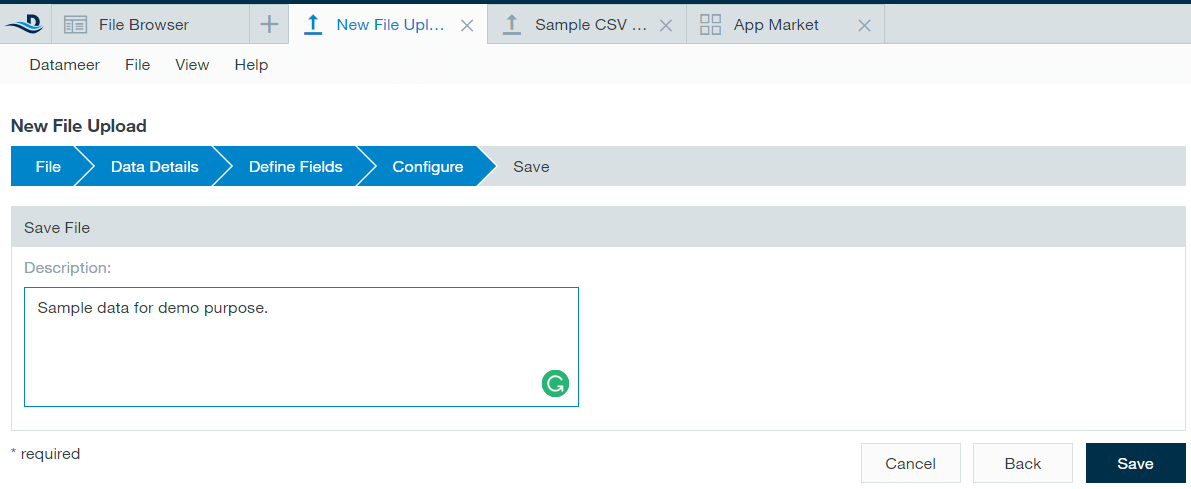
 Now in the last step, it will ask you, if you want to give any description to the file before the tool save your file. It is a good practice to provide any valid description so that others will also come to know why that file has been uploaded.
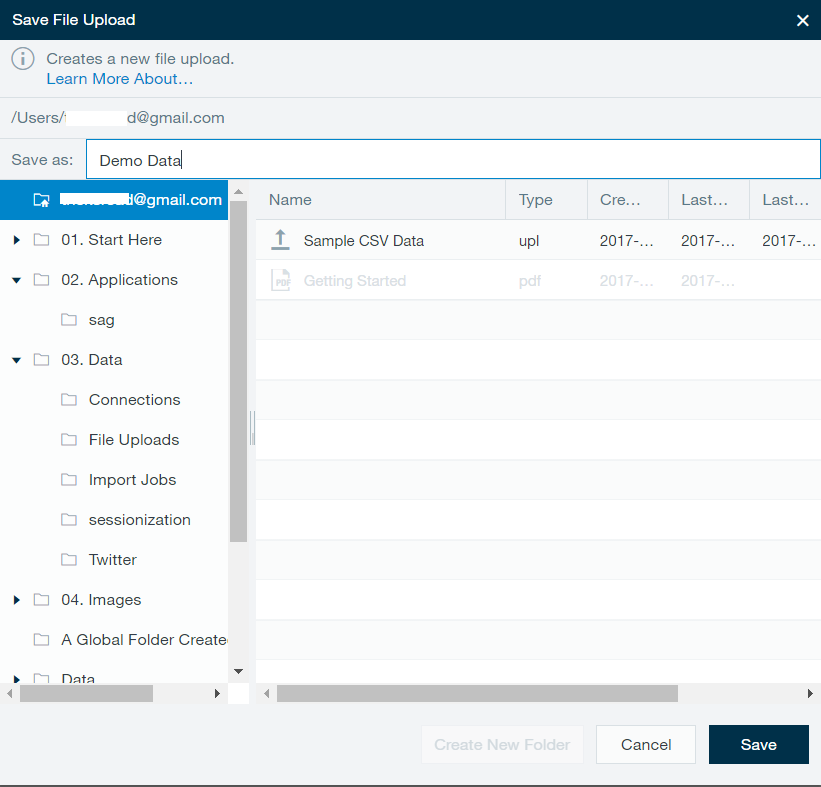
 Click on save button and it will show you a pop-up asking in which folder you want to save the file. You can select the folder as per the directory you are working.
 By this way, you can upload any file to the Datameer tool which will be ready to be worked. Initially, your file may show in the queue and can be used only after the file is processed.
You have uploaded a file now create the workbook so that you can see the data you have uploaded and done the further computations.
How to create a Workbook?
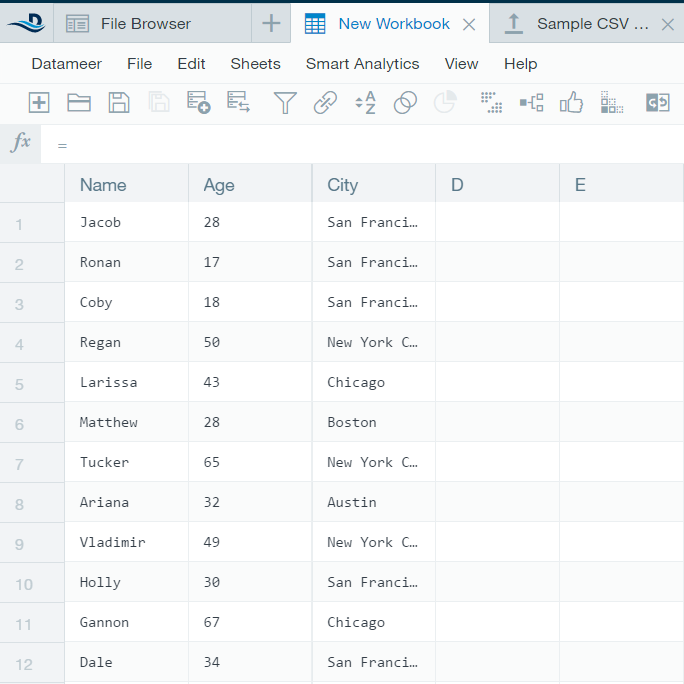
Here we will create a new workbook in Datameer so that we can work on the file we just uploaded. For this again move to File –> New Workbook.
 This will ask if you want to add any file in this workbook. We will add our newly uploaded file. But if you want, you can ignore and go to the workbook where you can do the analysis.
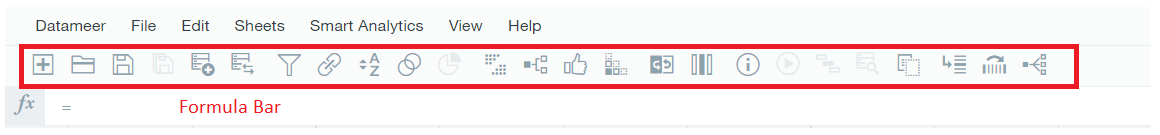
 Here you should get familiar with certain tools available at the top.
 Now whatever computations you want, you can do here. For example, if you want to group the data by the city in column D, just click on it and the tool will show you a popup where you can select the GroupBy option and select the City column as shown below.
 You can do similar calculation depending on your data and requirement. Here I will do the few.
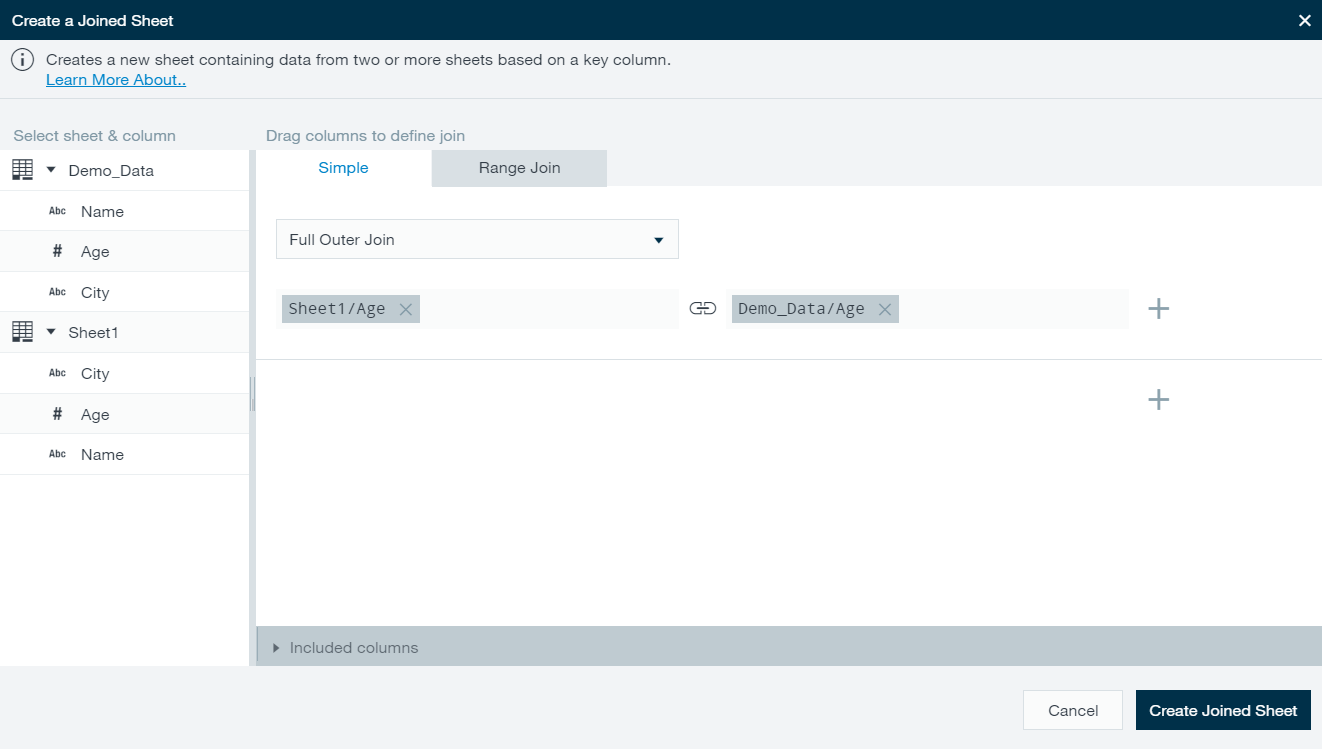
How to create Join in Datameer
To Join two or more sheets, you can click on the Join icon shown in the toolbar and it will show you one popup where you can select the kind of join you want and the join condition. This will create a new worksheet with the joined data.
 How to Flip the Sheet in Datameer
You can also quickly check the details of the worksheet you are working using the Flip icon available at the top.
 Once you are done with your work, you can save the workbook. Datameer will ask certain options while saving the workbook which you can check and are self-explanatory.
Please note this worksheet is not yet run and if you want to use this workbook somewhere you should run it.
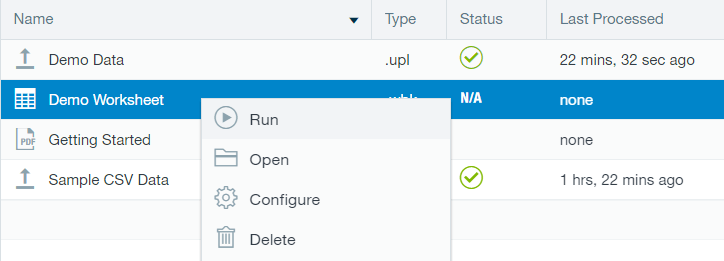
How to run a workbook in Datameer
Running a workbook is pretty simple in Datameer. Head over to the browser tab and right click on the workbook you want to run and click on run option. It will start running and the run time depends on the data workbook contains.
 How to Visualize Data in Datameer
Now we will move ahead with the visualization in Datameer. We will visualize the same data we added in our Demo Workbook.
For this again move to the File –> New Infographic
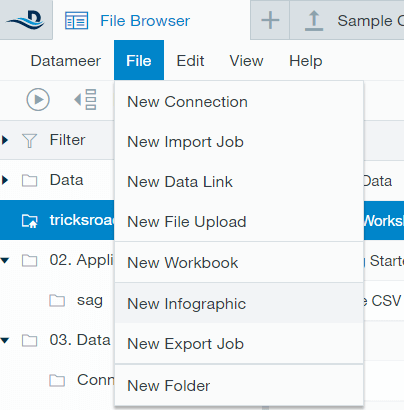 This will open a new tab in the Datameer window and will show you the Datameer Infographic window.
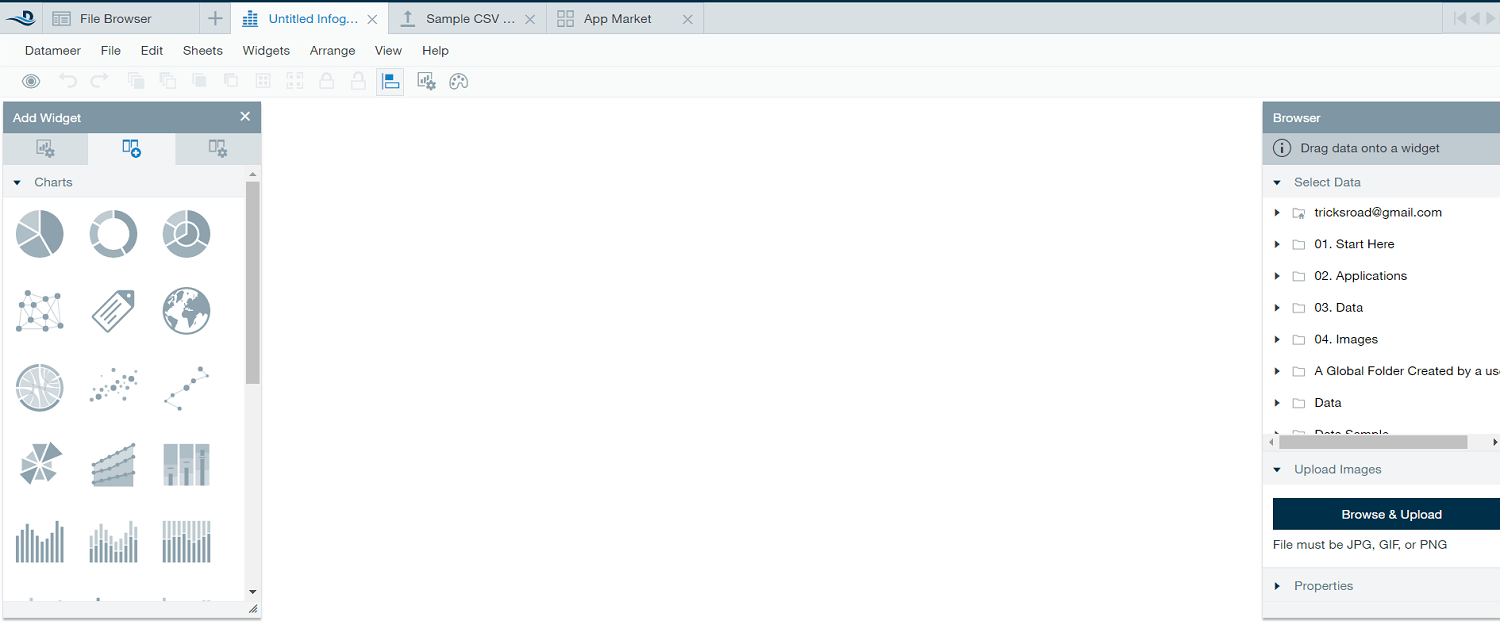 This is the place where you can drag the kind of graph you want, add data, make formatting and do the style as you want.
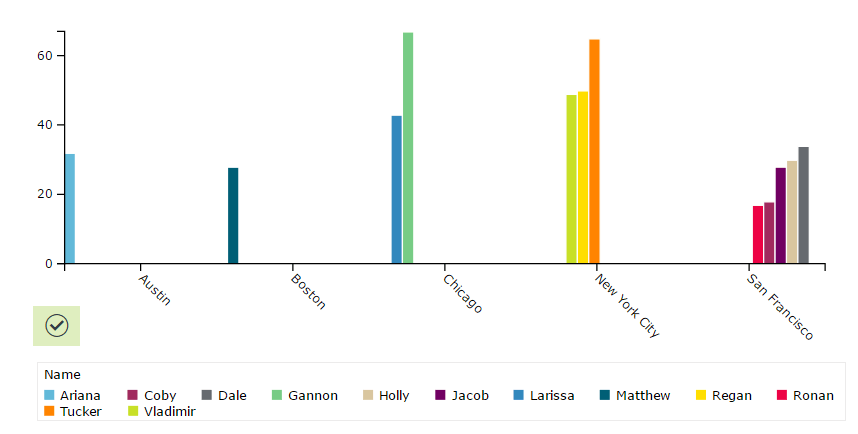
Let’s create a bar chart and show the city and the person in that city. I am just taking this simple example. You can work as you want depending on the data you have.
For this just drag the multi bar chart in the pane. Now as this is a multi-bar chart and so you will have to put the columns in data, label and category field. After some adjustment, you will have the graph as shown below.
 You can also visit the widget section available at the top bar to add new charts and other widgets like text, pivot etc.
Once done, again save your infographic and done. Then you can also check the dependencies of the infographic on the workbook and files by right clicking on it.
This was all about Datameer Tutorial. I have covered here Datameer for beginners and will share the advance guide later on this site. This Datameer for dummies was intended for the beginners and for advanced users we will share the detailed guide later in this Datameer series.
Do try Datameer and let us know for any issue/questions/concerns.
Datameer Tutorial
-
Software
-
Features
-
Pricing
-
Support
-
UI and Edge to Use
Datameer Tutorial Summary
Datameer is a big data analytics tool helping you to find the insight from the big data. This Datameer Tutorial will help you get started with the Datameer. Check out our videos for better understanding.


Hey
I know Datameer is also one of the popular data visualization tools for big data.
Running a workbook is pretty simple in Datameer. You have mentioned all steps are very good and easy to follow.
Thank you
Sweety