This is our Tableau visualization series where we are discussing several custom tableau reports. In this journey, we are going to see how to create funnel chart in tableau today.
But before getting into how to create funnel chart in tableau, let’s understand what is funnel chart?
What is funnel chart?
A funnel chart is basically used to describe a multi-layered process where each stage of the chart is a part of the process. To develop a funnel chart in tableau for this tableau tutorial, we are going to use our own sample superstore data.
In the funnel chart, each stage is a survival stage and processes will keep on getting eliminated at each stage, if not working.
For example, let’s say we need to climb a mountain that has 3 stages and several roadblocks. The person who is willing to climb the mountain need to pass each hurdle. But everyone who has started may or may not reach the top…agree?
So, let’s say, there are three checkpoints in the entire journey like below-
- Checkpoint-1
- Checkpoint-2
- Checkpoint-3
Now each one needs to reach checkpoint-1. Few of those who started may not go beyond checkpoint-1. While the remaining will reach checkpoint-2. Again, few will leave the journey while the others will continue. Again, checkpoint-3 will come and few will again leave the journey. The final who will pass and show the dedication to continue will be able to reach the top/destination. So, the entire process will have 3 checkpoints and finally the top which is a destination.
How to create funnel chart in Tableau- Step by step guide
As said, we are going to use the same sample superstore data for this tableau visualization. And we will create the funnel chart in tableau for the shipping mode. What we are trying to derive here is, how the shipping rate is varying as per sales.
But before going into the steps to create funnel chart in tableau, let’s see how it usually looks like-
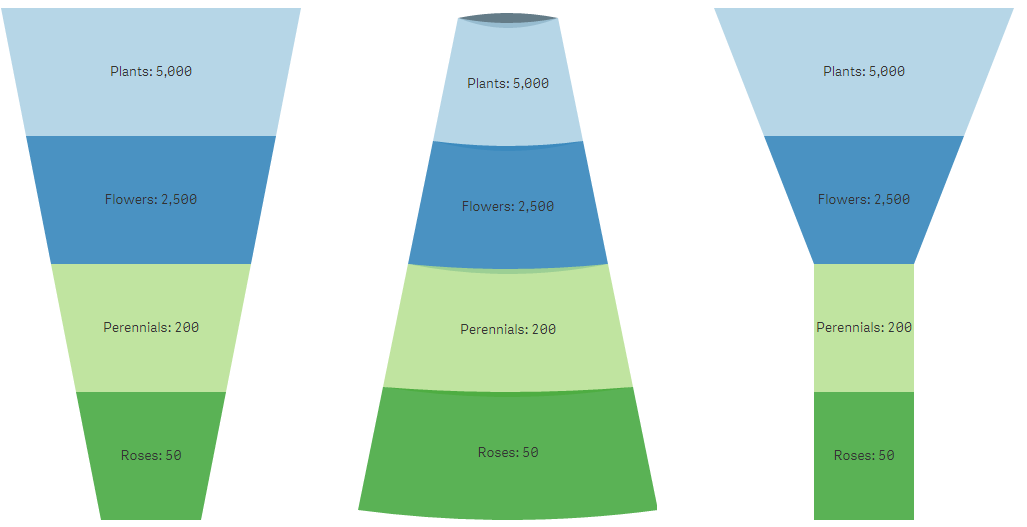 Yes, the funnel chart can be like any of the above three or even a bit twisted from the above. But more or less from a design perspective, it will look similar.
The creation of the funnel chart usually involves following three-steps-
 So, here also in tableau, we will be doing exactly the same. We will first create an area chart and then the second. And will finally flip it.
Let’s start and see the steps to create funnel chart in tableau:
Step 1:
Connect the Sample superstore data’s Order tab to your tableau.
Step 2:
Drag the “Ship Mode” dimension to the row shelf and “Sales” measure to the column shelf.
Step 3:
Select the chart type as area. This you can select from the Marks as shown below.
 Step 4:
Now we need to sort this graph. For this right-click on the ship mode dimension available in the row shelf and select “sort”. And select descending order by the sales field as shown below:
 Step 5:
Create a calculated field for the negative sales and name it anything you like (CF_Negative_Sales, in my case). This will be just –[sales].
 Step 6:
Drag this negative sale calculated field in the column shelf before the sum(sales). This will look like below. Make some adjustments to height, width, and color as needed.
 Step 7:
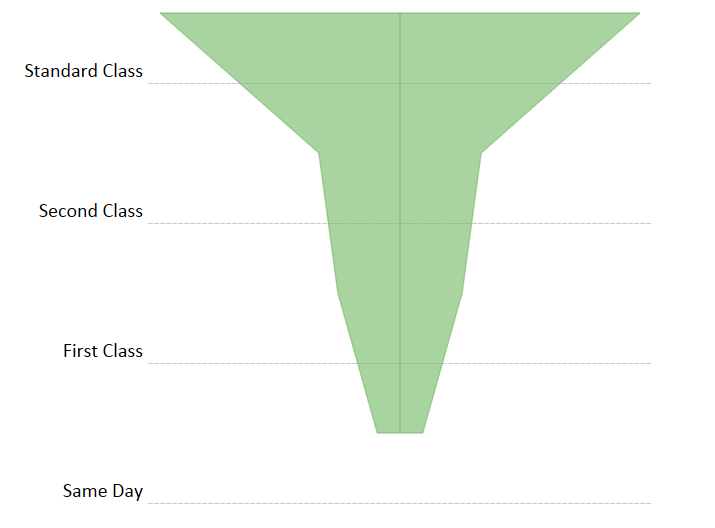
Now show/hide/change axis and header as required. If you want to show the sales value also, you can enable it from the label. You should also hide the gridlines wherever not required by formatting the worksheet. Once done, the final funnel chart in the tableau will look like below.
 That’s all!
We have successfully created the funnel chart in tableau for the shipping mode vs sales. There are many other methods as well to create the funnel chart in tableau like reversing the axis instead of going ahead with a calculated field. But I find the calculated field as the easiest one. Here’s our pick for fulfillment.
A funnel chart will be highly helpful when dealing with the customer acquisition funnel, any survival kind of process, or while making the sales adoption process.
Make sure to do formatting carefully to create a stunning funnel chart in Tableau. If you need any further help, we recommend checking the below video.
Do try and let us know of any issues.


Leave a Comment